Key Figures
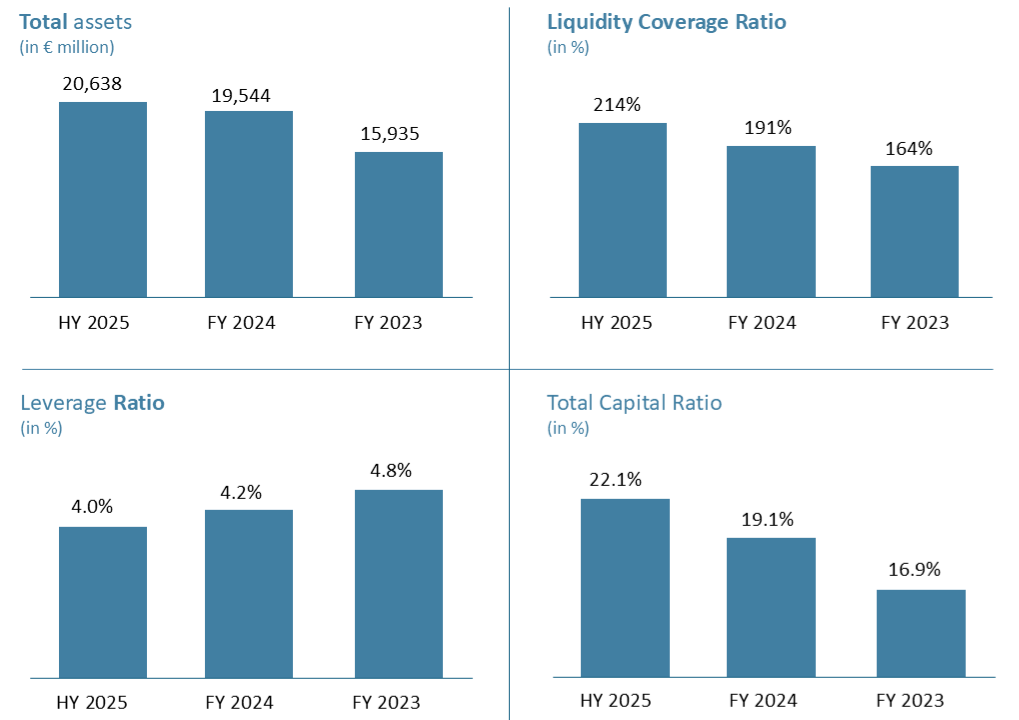
In this section you will find an overview of our key financial figures.

| KERNCIJFERS (in EUR miljoenen) | |||
|---|---|---|---|
| Achmea Bank NV | HY 2025 | FY 2024 | FY 2023 |
| Total assets | 20,638 | 19,544 | 15,935 |
| Mortgages (nominal) | 18,689 | 17,344 | 14,378 |
| Savings | 10,156 | 10,102 | 9,178 |
| Total own funds | 962 | 962 | 774 |
| Risk Weighted Assets | 4.361 | 5,043 | 4,585 |
| Profit before income taxes | 40 | 92 | 81 |
| LCR (Liquidity Coverage Ratio) | 214% | 191% | 164% |
| Leverage Ratio | 4.0% | 4.2% | 4.8% |
| NIM (Net Interest Margin) | 1.19% | 1.45% | 1.54% |
| Common Equity Tier 1 Ratio | 19.2% | 16.6% | 16.9% |
| Total Capital Ratio | 22.1% | 19.1% | 16.9% |